
Manage a Sports Team PBL Math Project

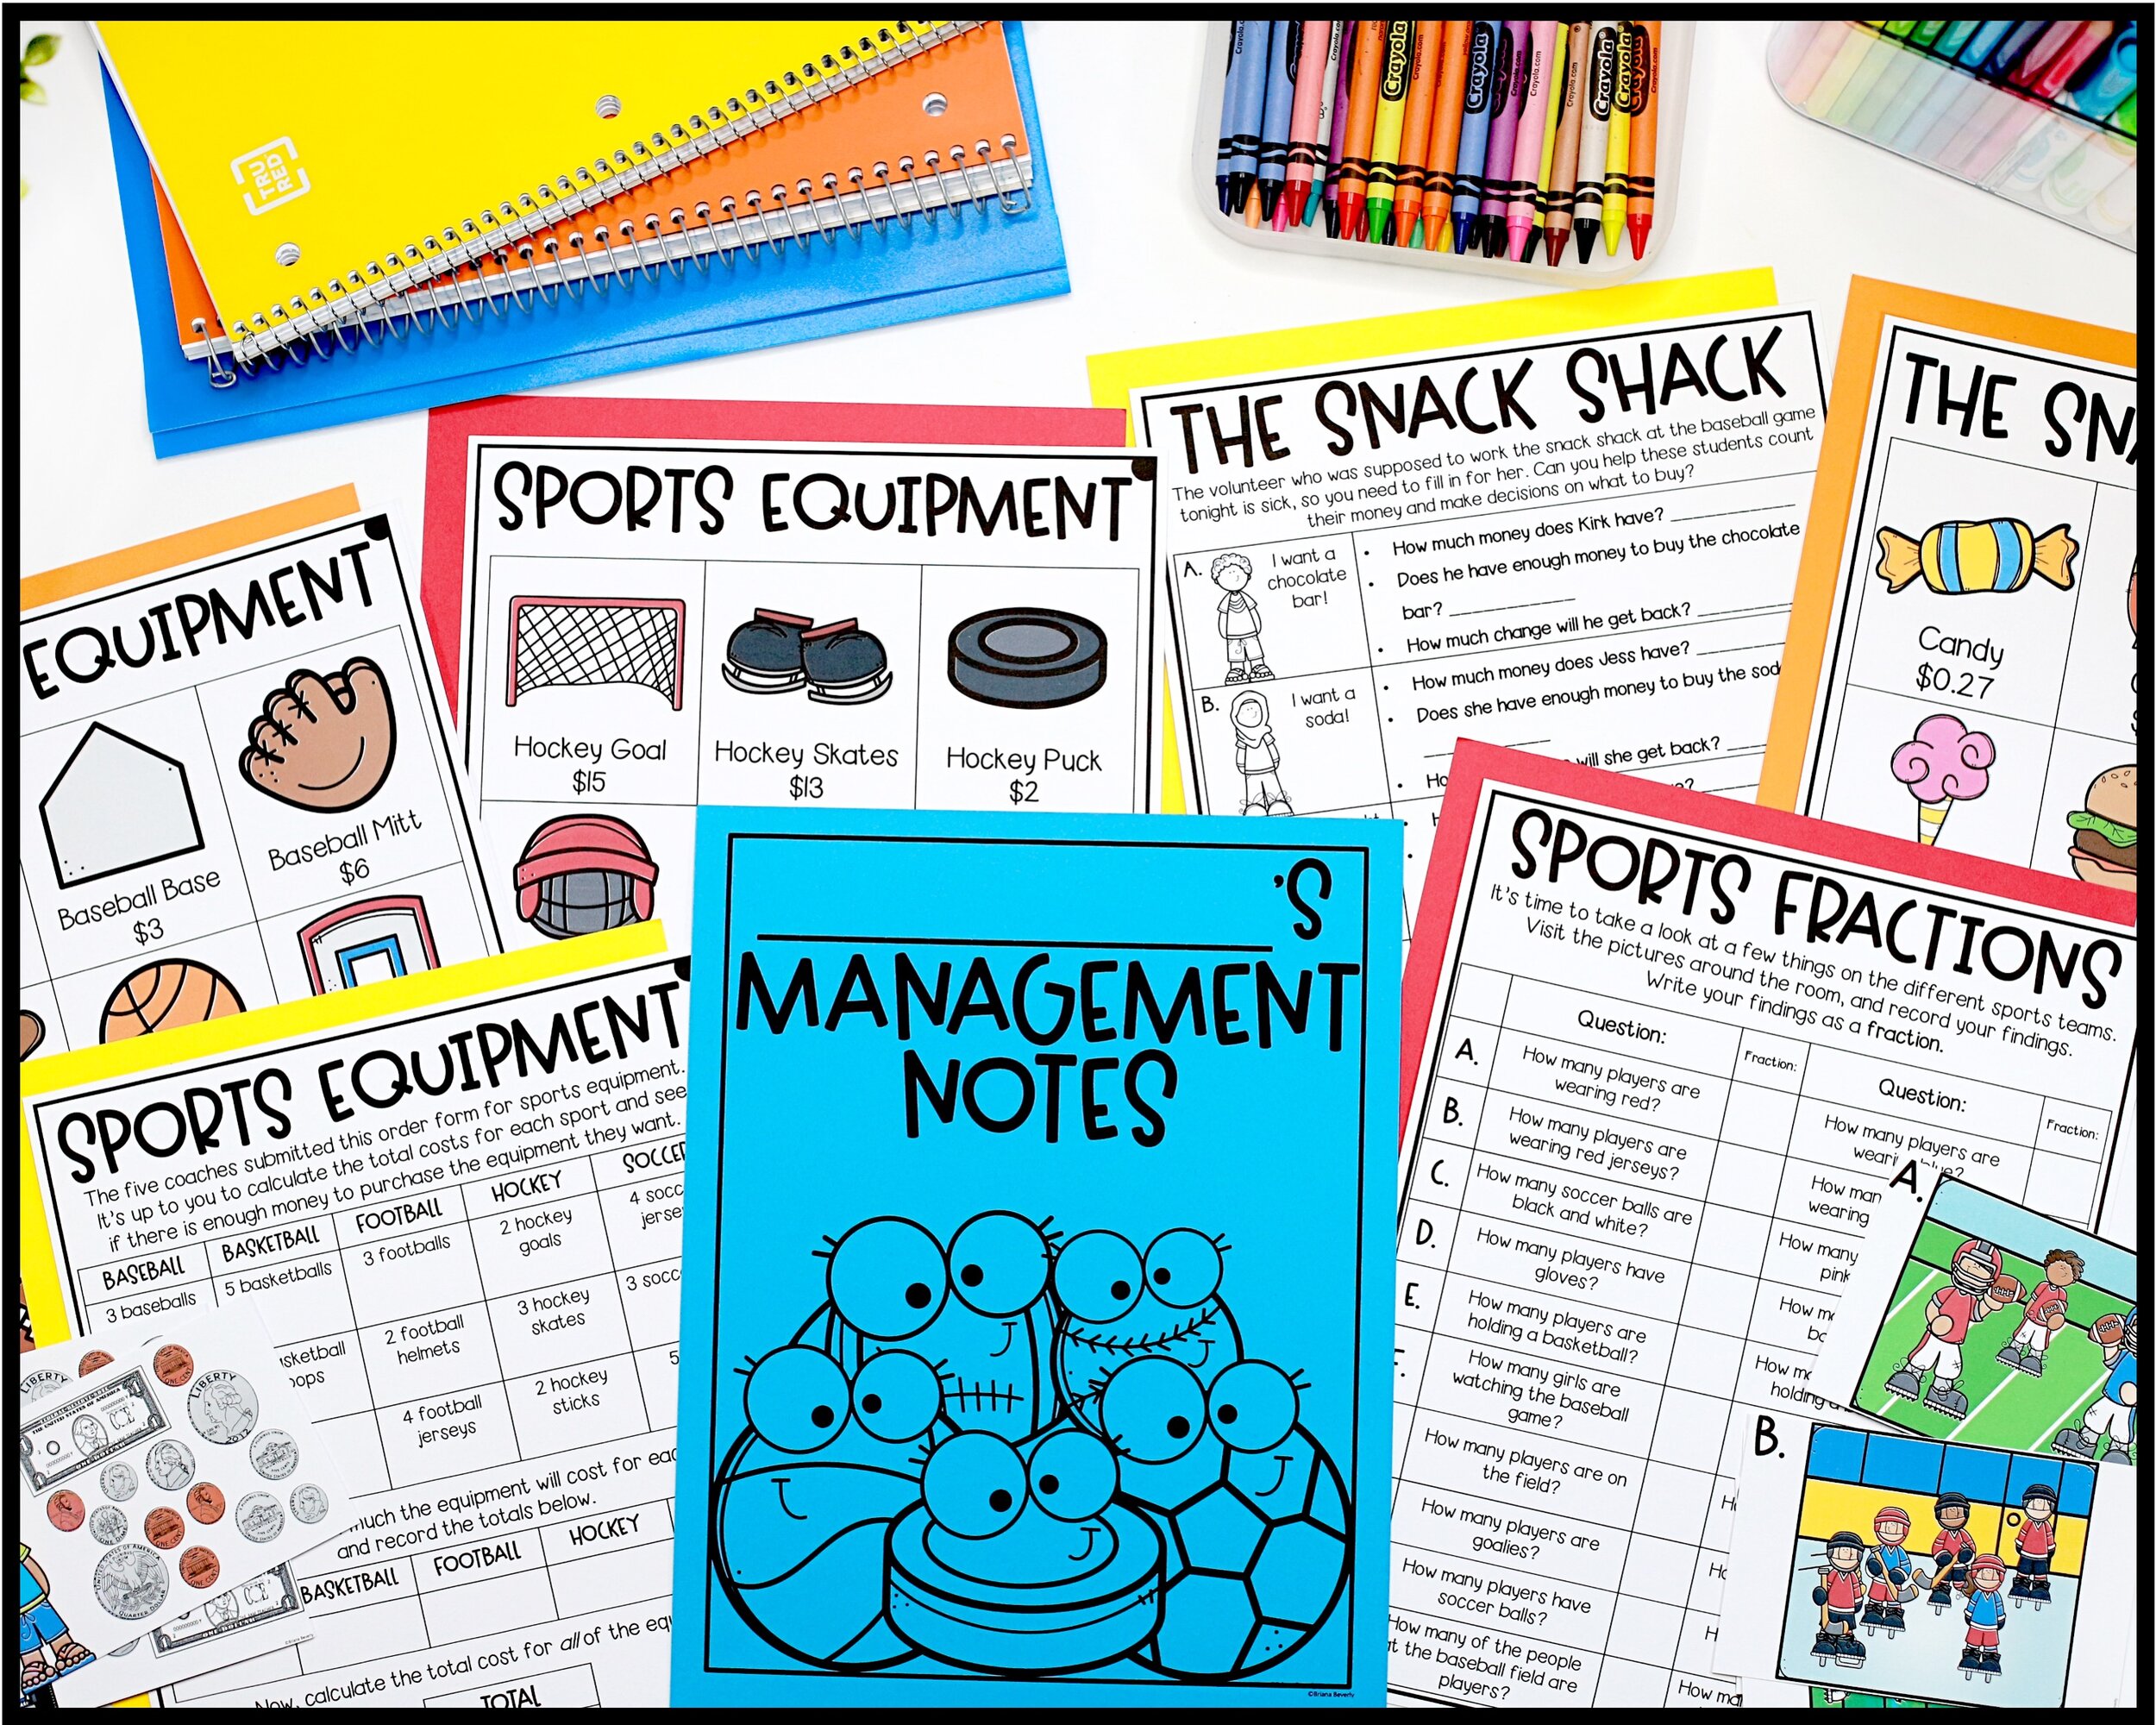
Manage a Sports Team PBL Math Project
Project Based Learning Math Activities
This math PBL project will have your students practicing real-world math applications while having a BLAST! This project based learning task is a great extension and enrichment activity for your early finishers. This project has students acting as managers of their school's sports teams (baseball, basketball, football, hockey, and soccer!). They must make several decisions about the sports program, practicing several common core math standards along the way. Students will love getting to make decisions as the boss and YOU will love the enriched math practice they get along the way.
This pack would be great for enriching second graders, perfect for third graders, and even a great review for upper grades! This is perfect for an end of the year cumulative or spiral math project!
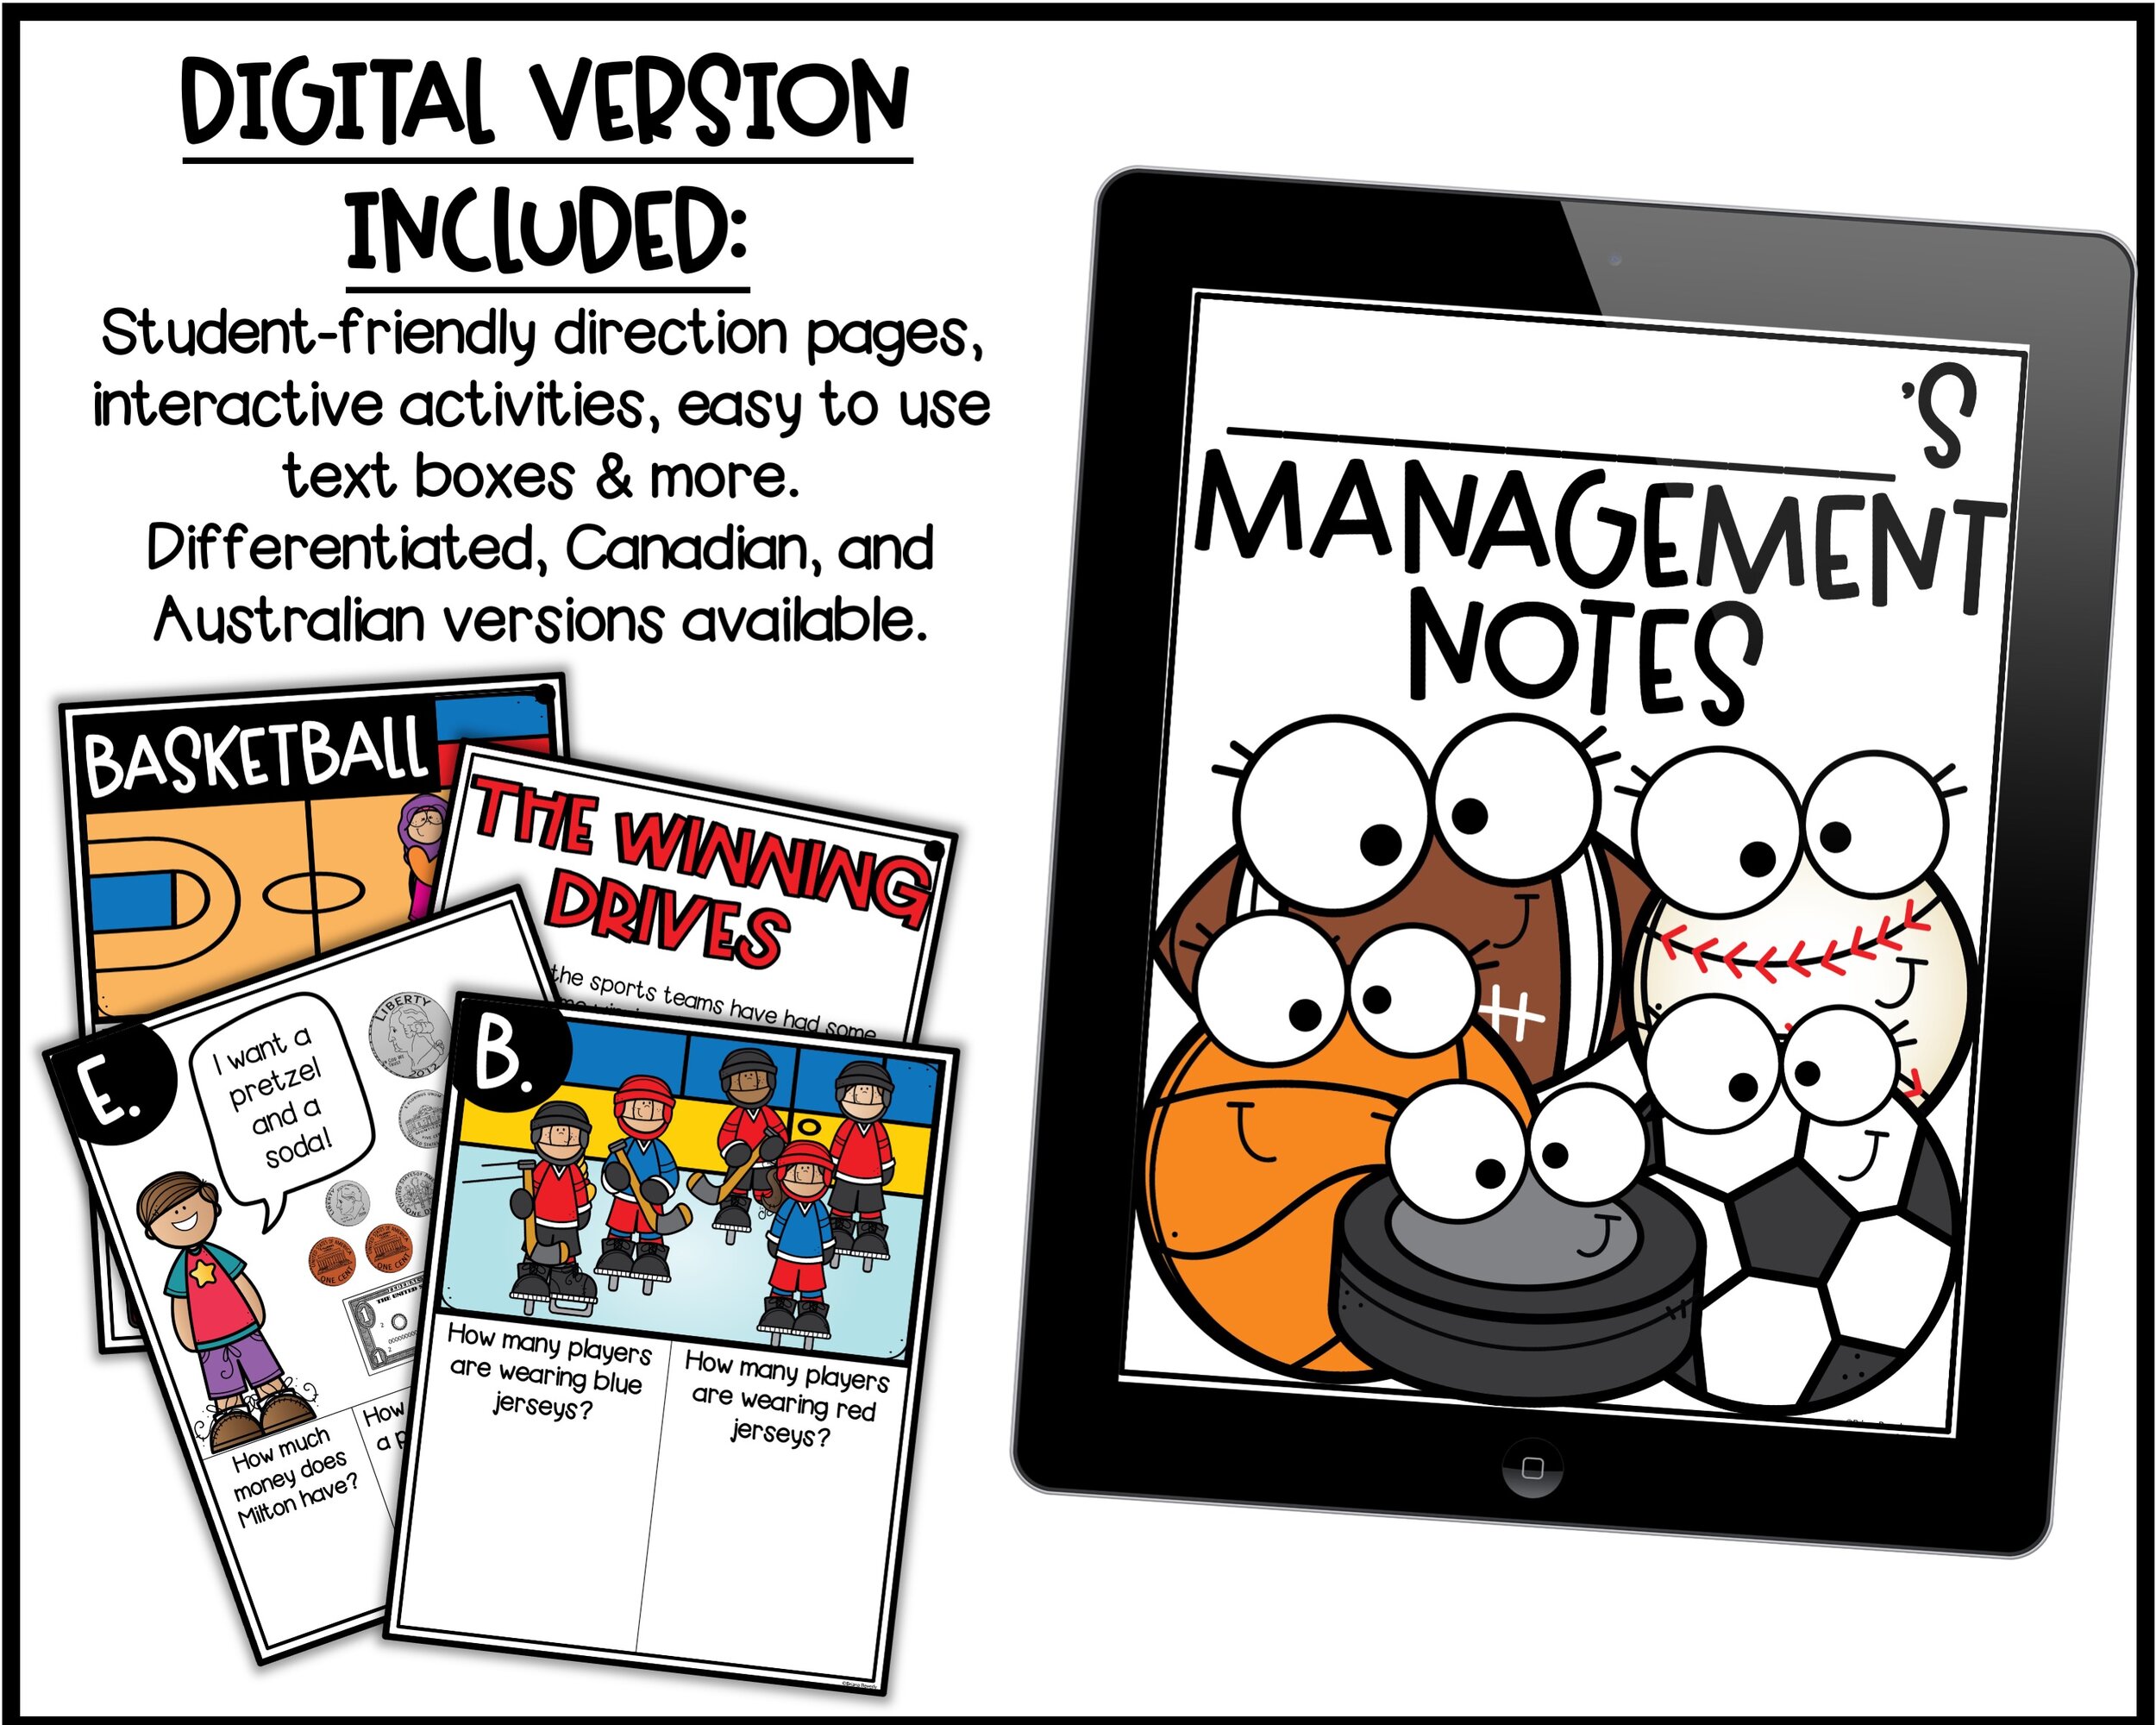
This product is DIFFERENTIATED for you and your students, and includes U.S., Australian, and Canadian versions!! It also includes both Printable & Digital Google Slides versions.
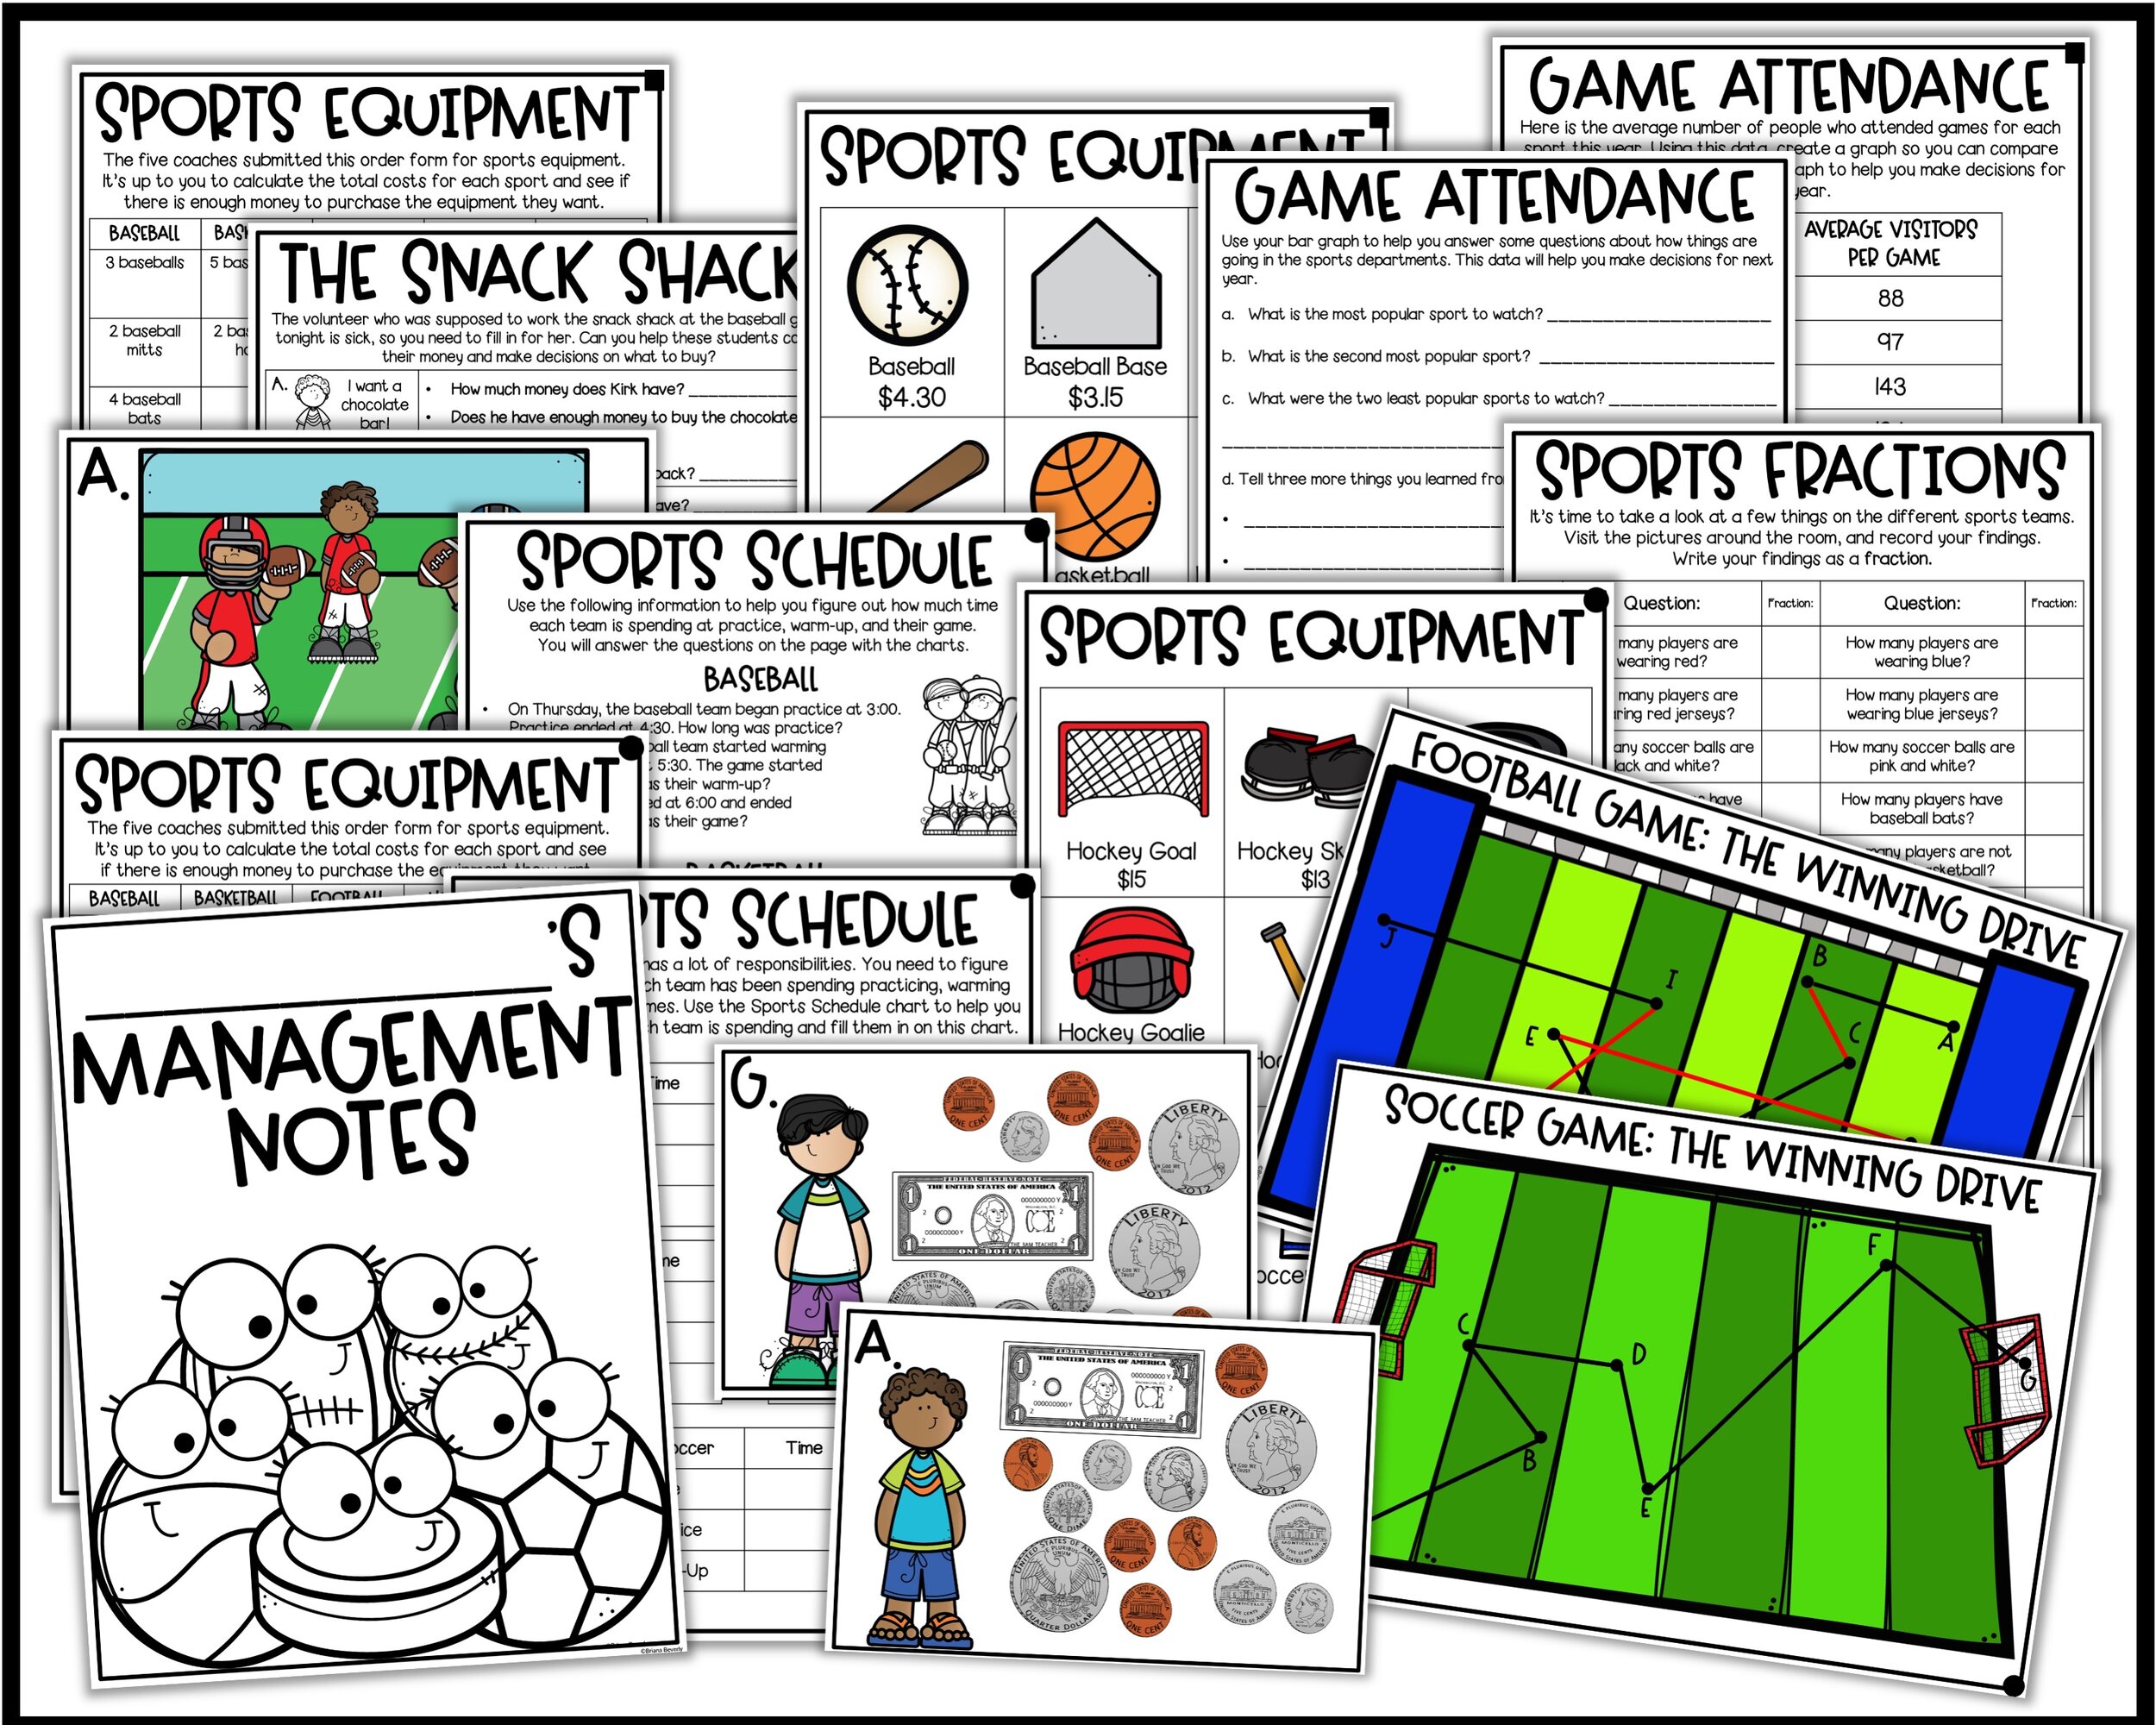
⭐ HERE ARE THE TASKS STUDENTS WILL COMPLETE:
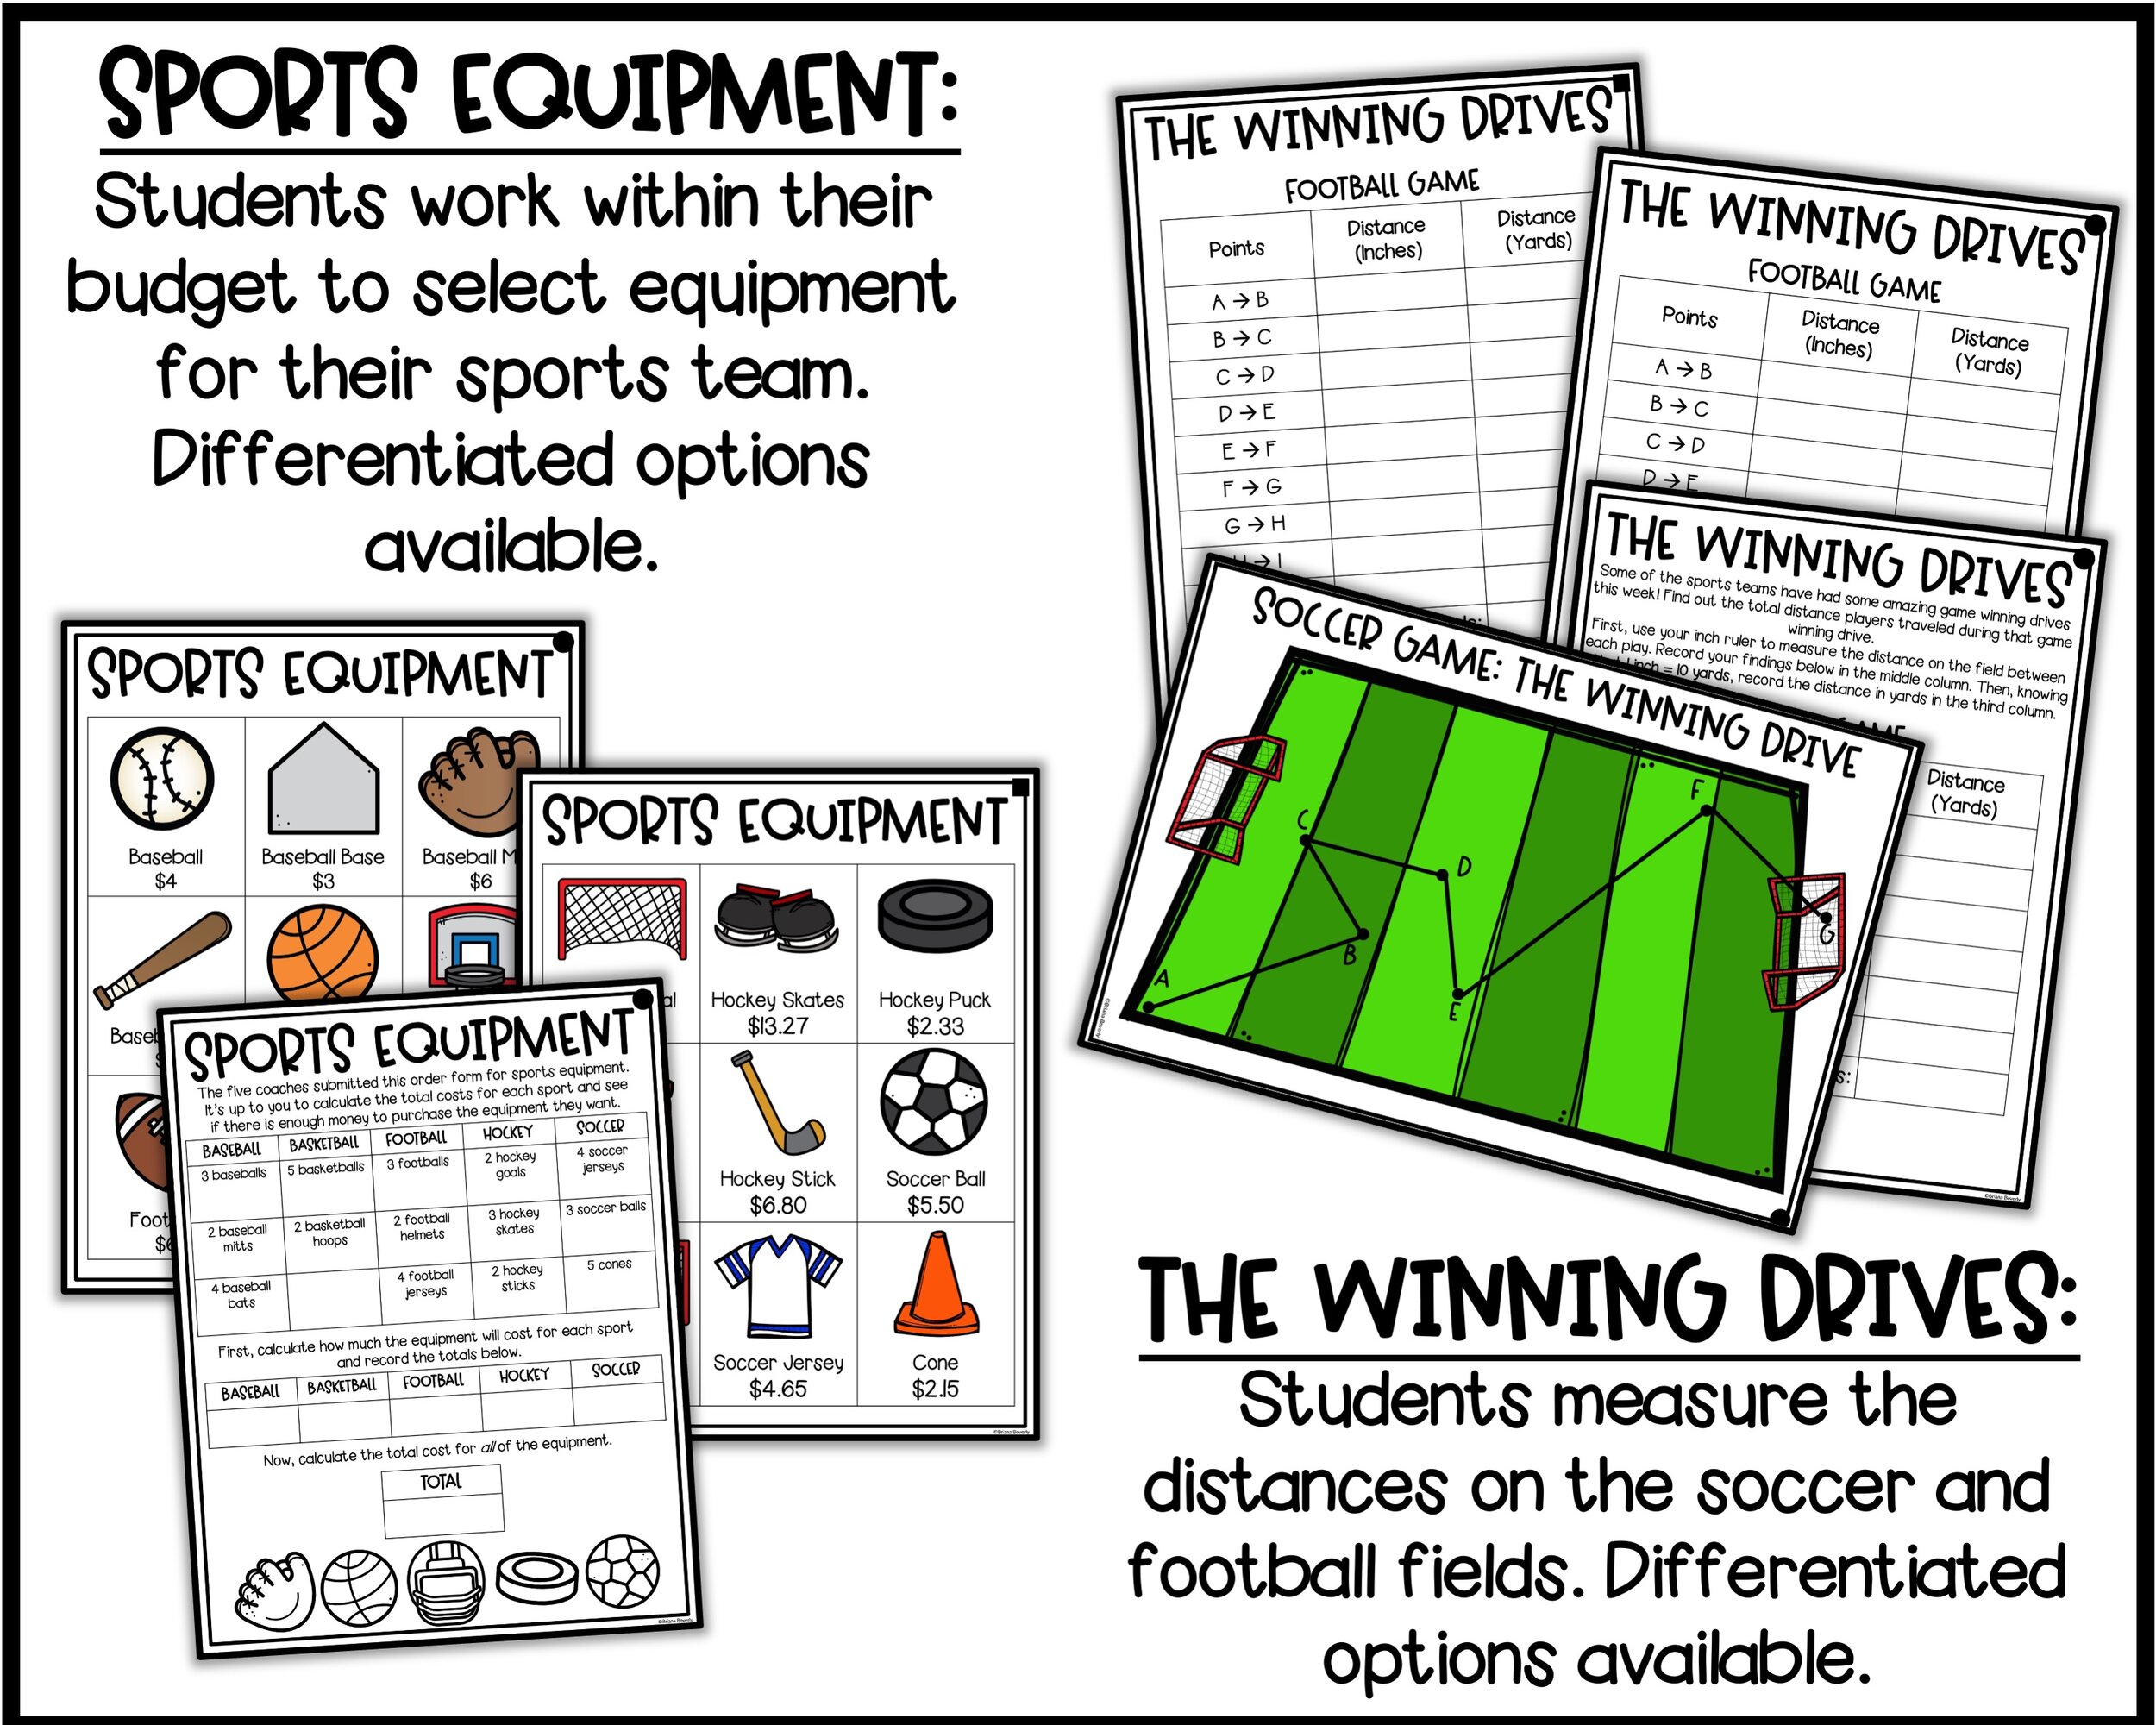
•Sports Equipment: The coaches have ordered sports equipment for their respective sports. Students must add up their totals using differentiated menus.
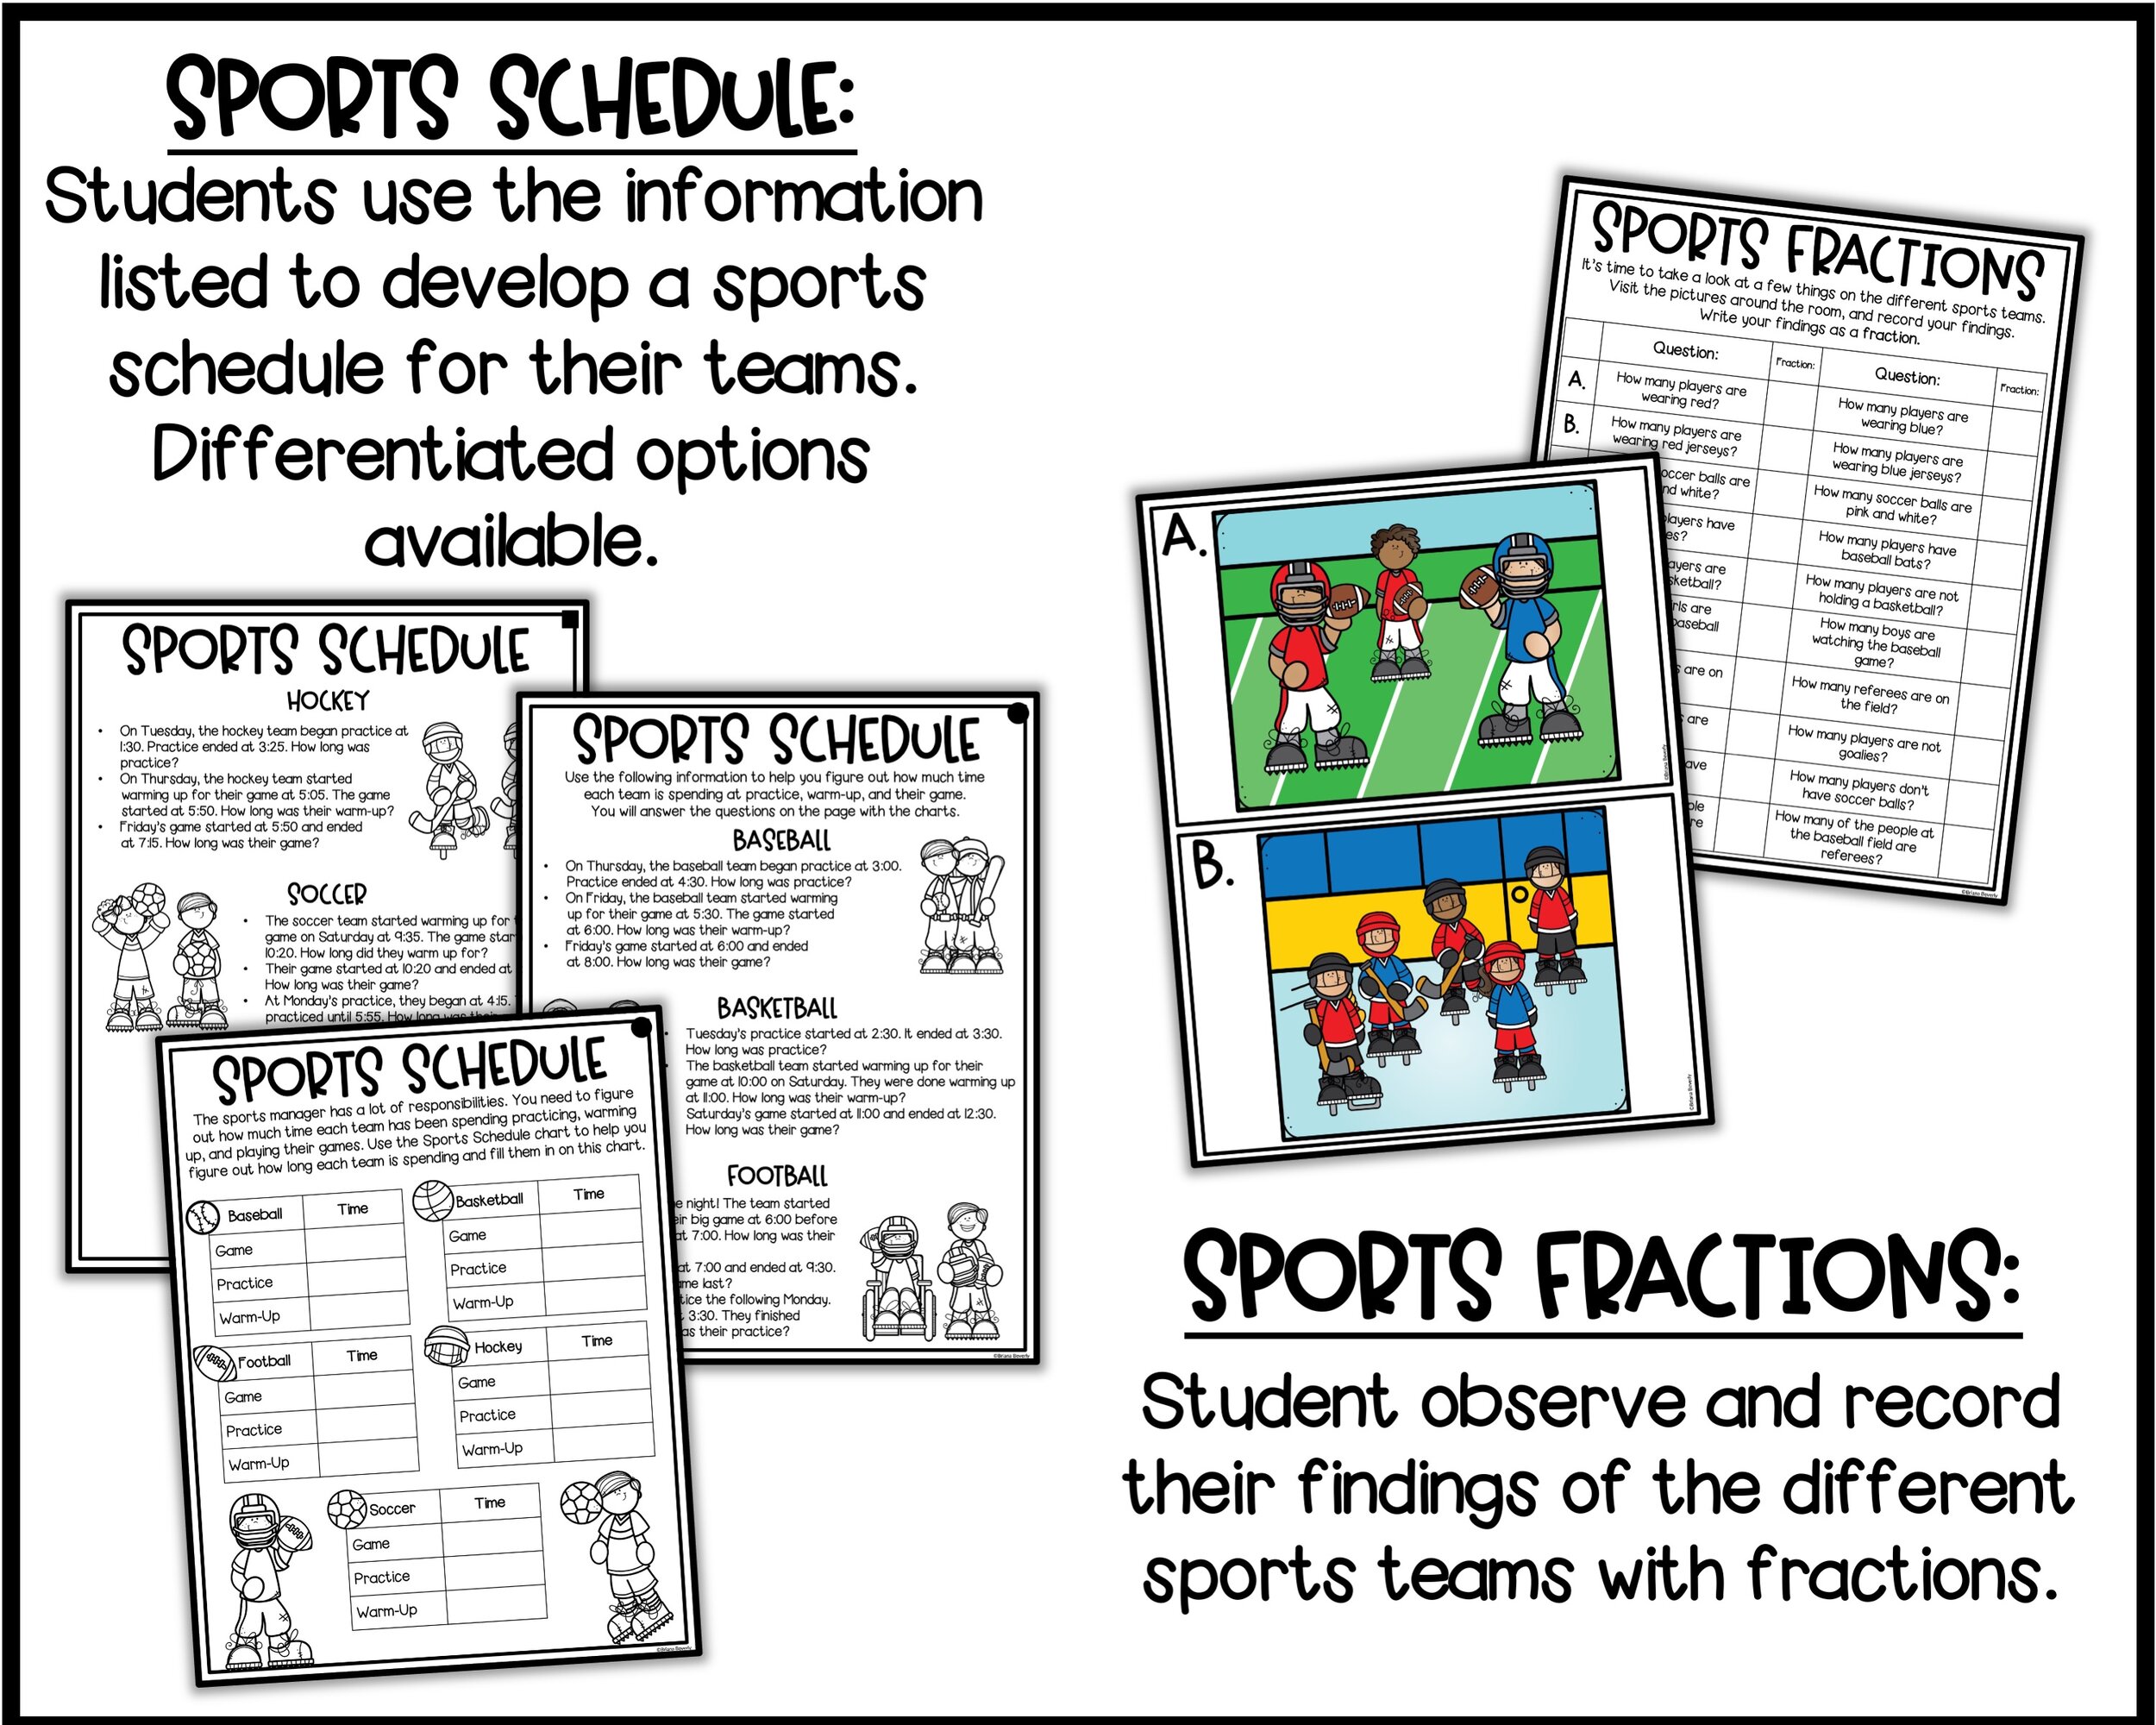
•Sports Schedule: Students must calculate the amount of time each team spends practicing, warming up, and playing a game. Differentiated menus are provided – one uses 30 minute increments and one uses 5 minutes increments.
•The Winning Drives: Students must measure the distances the football team and soccer team went on their winning drives. Students measure the lines on the field in inches and record them, and then convert them to yards.
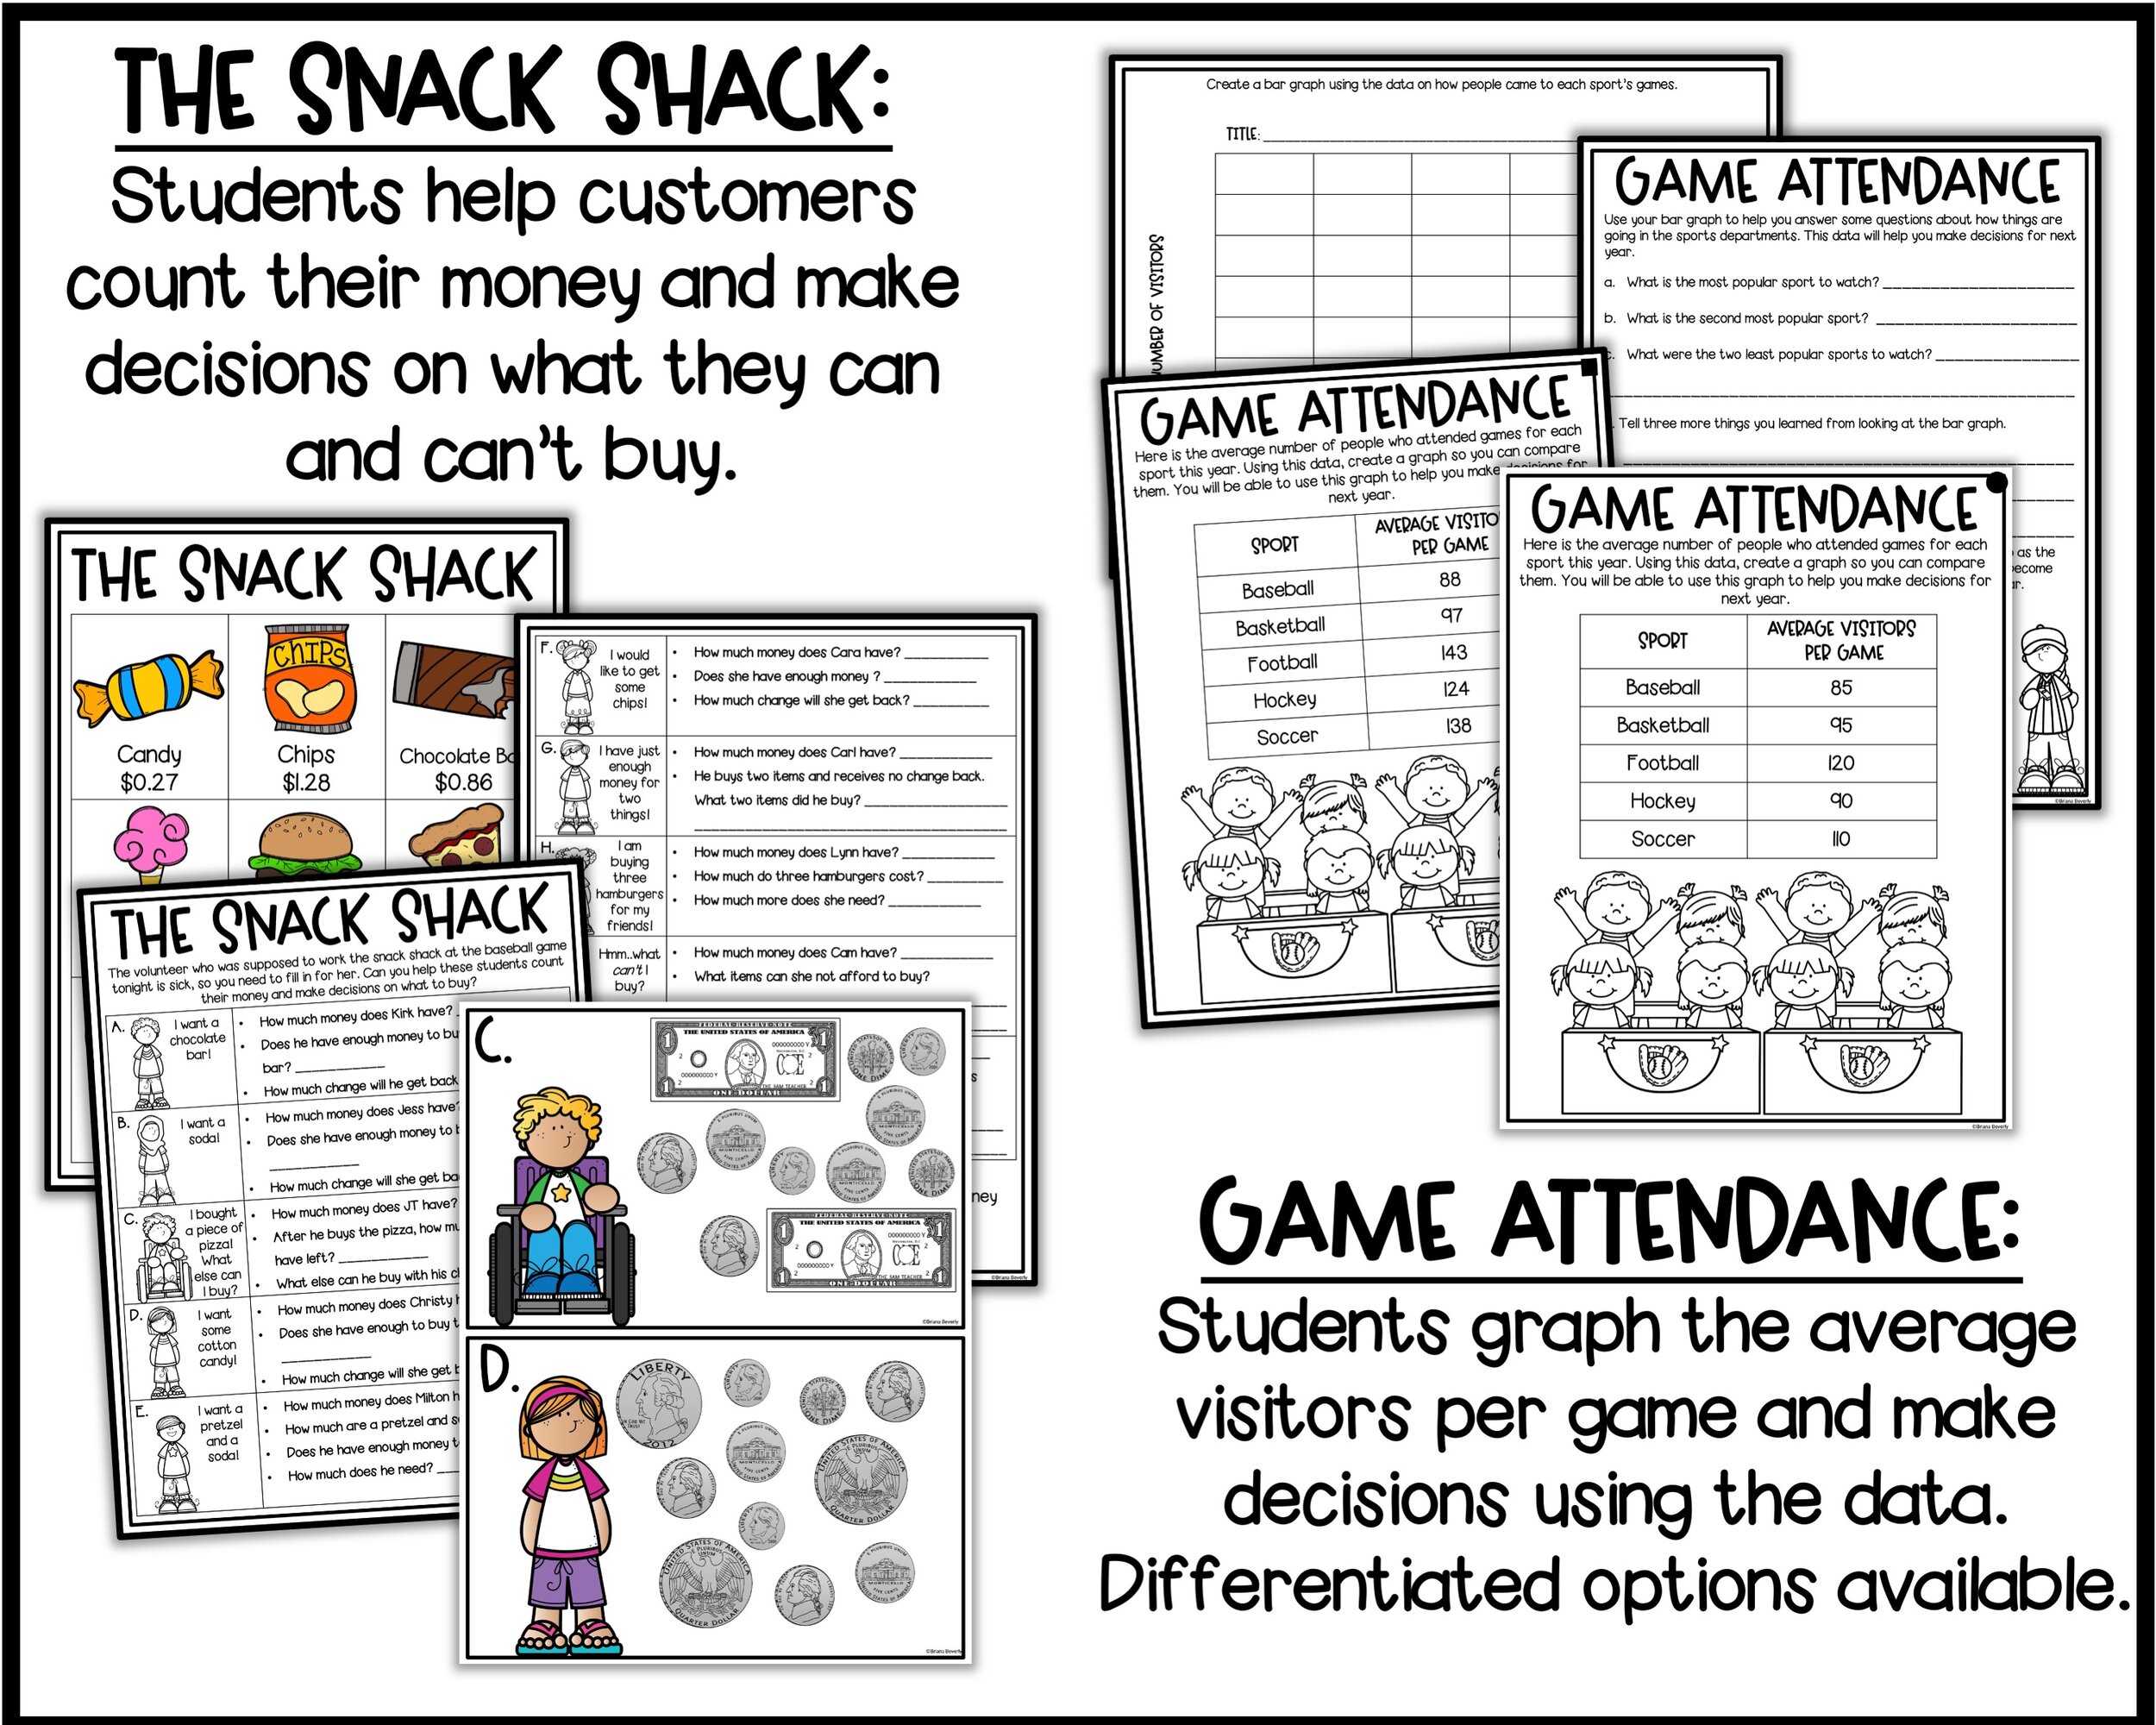
•The Snack Shack: Students must help out at the snack shack and help students count their money and decide what they can and can’t buy. Students will travel around to task cards to count money and answer the challenging questions on their recording sheet.
•Game Attendance: Students will use differentiated data sets to create a bar graph showing average game attendance for each sport. They will then use their graph to draw conclusions about what they can do next year to improve attendance at some of the less popular sports.
•Sports Fractions: Students will travel to various task cards around the room and record fractions associated with the picture on their task cards.